Choosing an Ebike Display is not simply about screen size or colorful graphics. It affects safety, comfort, battery awareness, and daily riding confidence. A bright display can become unreadable under direct sunlight. A compact unit may feel elegant, yet its small buttons can frustrate riders wearing gloves.
Claus Fleischer, CEO of Bosch eBike Systems, offers a useful principle: “A display should provide useful information without taking attention away from riding.” This idea shapes the guide behind “10 Ebike Display Tips Every Buyer Should Know.” We will examine visibility, control layout, waterproofing, battery accuracy, navigation, connectivity, and repairability. These details often matter more than impressive specifications.
Real riding exposes weaknesses quickly. A screen may fog after a cold morning ride. Bluetooth pairing may fail beside a busy road. Some displays show remaining battery percentage, but that number cannot predict every hill, temperature, or riding mode. Buyers should question marketing claims and test the interface whenever possible.
There is no perfect Ebike Display for everyone. Commuters may prefer simple controls and strong contrast. Tourers may need navigation and extended data. Performance riders might value cadence, power, and responsive feedback. Even experienced buyers can overlook mounting position or glare.
This guide keeps the evaluation practical. It focuses on what riders can see, touch, understand, and trust after months of use. A few recommendations may challenge common assumptions. That is intentional. Good buying decisions require curiosity, comparison, and a willingness to reconsider attractive features.
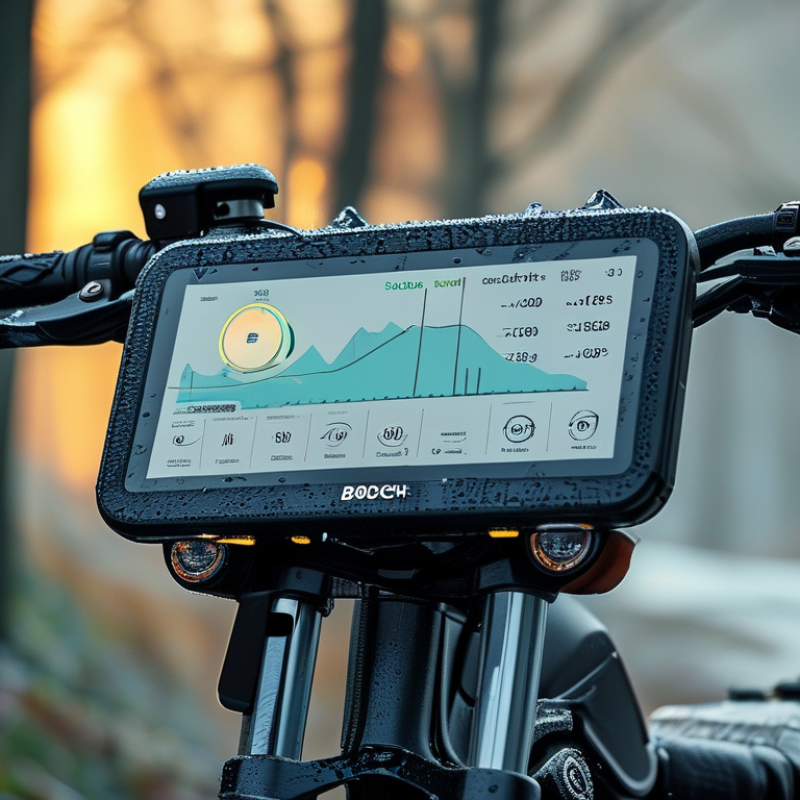
An ebike display should make compliance easy to understand. In many European markets, EN 15194 applies to pedal-assisted cycles with assistance limited to 25 km/h and 250 W rated continuous power. Check whether the screen shows kilometres or miles. A simple unit error can make a legal reading look suspicious.
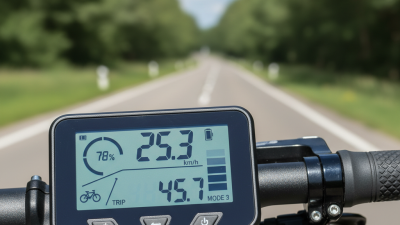
Watch the speed number during a flat-road ride. Assistance should stop near 25 km/h, although small differences may appear from wheel size, tyre pressure, or sensor calibration. The motor may stop helping while the bicycle still rolls faster downhill. That is normal. The display should also identify power clearly, such as watts or a readable assist level. Do not confuse peak output with rated continuous power.
Look closely at the wheel-size setting. It affects speed accuracy. A wrong setting can show 25 km/h when your actual speed is different. A GPS check can help, but it is not perfect in tunnels or beside tall buildings. Ask the seller for the technical specification, not just a marketing screenshot. Keep the manual and configuration record. Local rules may add requirements beyond EN 15194, so verify them before riding on public roads. Some displays hide useful data behind tiny icons. That is a design weakness, not your fault.
An ebike display should make its legal class clear, not merely advertise speed. In the United States, Class 1 usually means pedal assist up to 20 mph. Class 2 commonly includes a throttle and also stops assistance at 20 mph. Class 3 generally supports pedal assistance up to 28 mph. State rules can differ.
Check the settings before buying. A display showing “28 mph” does not automatically make the bicycle Class 3. Confirm whether the throttle is limited to 20 mph and whether pedal assistance reaches 28 mph. Some displays let riders select modes that change acceleration, but the speed cutoff should remain consistent with the stated class. Ask for the manual.
Tip: Test the cutoff on a quiet, legal route. Watch the display as assistance fades near 20 or 28 mph. Do not rely on a phone speed app alone; wheel size, tire pressure, and calibration can affect readings. I have found that unclear icons cause more confusion than low battery warnings. That is easy to overlook.
Tip: Look for a visible speedometer, especially on a Class 3 model. Several U.S. jurisdictions require or expect one for higher-speed electric bicycles. Confirm local requirements for bike paths, roads, helmets, and age limits before riding. A seller’s “street legal” label is not enough evidence. Save the class rating and display instructions with your purchase records. Mistakes happen, and displays are not always perfectly calibrated.
A trustworthy ebike display should show more than a bright battery icon. Check whether it reports percentage, voltage, or five simple bars. Percentage readings are useful, but they can fall quickly under heavy acceleration. Voltage may look stable while the battery is nearly empty. That difference matters on hills, cold mornings, and longer commutes. No display is perfectly honest.
Tip: Compare the displayed battery level after a full charge, a ten-mile ride, and a short rest. Record the numbers. If the percentage jumps after stopping, the system may be estimating rather than measuring directly. That is not automatically a defect, but buyers should understand it. Read the manual carefully, because some displays hide useful charging data behind a settings screen.
Range estimates require even more caution. A displayed “40 miles remaining” may assume flat roads, light loads, moderate speed, and warm weather. Real riding rarely follows those conditions. Test the estimate against your route, including hills and frequent stops. Check whether the range changes when you select different assistance levels. Small changes can reveal the calculation method.
Tip: Keep a simple ride log. Note distance, battery percentage used, temperature, tire pressure, and assist level. After several trips, compare the predicted range with actual results. My own evaluation would not trust one ride; that is an easy mistake. Also inspect charging data. A clear charge indicator should show progress consistently, without sudden unexplained increases or interruptions.
| No. | Display Data to Check | What Accurate Data Should Show | Practical Evaluation Method | Useful Reference or Formula |
|---|---|---|---|---|
| 1 | Battery Percentage | A stable percentage that decreases progressively rather than dropping sharply during normal riding. | Compare the displayed percentage with the battery-management app or charger reading after a full charge and after a controlled test ride. | Percentage is an estimate based on battery voltage, current, temperature, and a stored capacity profile. Voltage alone is less reliable under acceleration or heavy load. |
| 2 | Battery Voltage | The display should identify the system voltage and show readings consistent with the battery’s nominal rating. | Confirm that the display setting matches the battery label or technical specification, without relying only on the percentage indicator. | Common nominal systems are 36 V and 48 V. A fully charged lithium-ion pack is typically above its nominal voltage; exact values depend on cell configuration and charger settings. |
| 3 | Battery Energy Capacity | Capacity should be stated in watt-hours (Wh), not only ampere-hours (Ah). | Check whether the advertised Wh value can be calculated from the stated voltage and ampere-hours. | Wh ≈ V × Ah. Example: 48 V × 15 Ah ≈ 720 Wh under nominal conditions. |
| 4 | Remaining Range Estimate | The estimate should change with recent riding conditions and should not remain fixed regardless of speed, terrain, or assistance level. | Ride a repeatable route and record starting battery percentage, distance, average speed, assist level, temperature, and ending percentage. | Range is affected by rider mass, hills, wind, tire pressure, temperature, stop-and-go traffic, speed, and assist level. A displayed maximum range is not a guaranteed distance. |
| 5 | Energy Consumption | A useful display may show watt-hours per kilometer or watt-hours per mile, allowing comparisons between rides. | Compare displayed consumption with battery energy used over a measured route. | Energy use ≈ Battery Wh used ÷ Distance. Higher speed, steep climbs, low tire pressure, and cold weather generally increase energy use. |
| 6 | Motor Power and Current | Power and current readings should respond logically to acceleration, hills, and assist-level changes. | Observe whether power rises under load and falls when pedaling lightly or traveling downhill. | Electrical power ≈ Voltage × Current. Short peaks can exceed the motor’s continuous rating; therefore, peak and continuous values should not be confused. |
| 7 | Charger Voltage and Current | The charger output should match the battery system’s required charging voltage and use a compatible current rating. | Read the charger label and compare its output voltage with the battery documentation before connecting it. | Do not substitute a charger solely because the connector fits. Incorrect voltage or polarity can damage the battery and create a safety hazard. |
| 8 | Estimated Charging Time | The displayed or stated time should account for the starting state of charge and the slower final phase of charging. | Time a charge from a known percentage and compare the result with the charger’s rated output. | Basic estimate ≈ Battery Ah to add ÷ Charger A. Actual time is longer because charging current normally tapers near full charge. |
| 9 | Charge and Discharge History | The system should record charge cycles, date, energy added, and any unusual voltage or temperature events when those features are available. | Look for consistent capacity over time and investigate sudden changes rather than judging battery health from one ride. | Battery aging depends on cycle depth, heat, storage state, charging habits, and calendar age. A cycle count alone does not fully determine battery condition. |
| 10 | Temperature and Low-Battery Warnings | The display should provide clear warnings for low charge, excessive temperature, charging faults, or communication errors. | Check warning visibility in daylight and confirm that alerts remain understandable while riding. | Cold conditions can temporarily reduce available power and range. A battery that becomes unusually hot, swells, leaks, or smells abnormal should not be used or charged. |
10 Ebike Display Tips Every Buyer Should Know?
Electric two- and three-wheeler sales exceeded 10 million units in 2023, according to the IEA’s Global EV Outlook 2024. More riders now depend on displays in rain, dust, and harsh sunlight. A readable screen is not a luxury. It supports safer speed checks and battery decisions.
Check the IP code against IEC 60529. IP65 means dust-tight protection and resistance to water jets. It does not promise safe immersion. IP67 adds temporary immersion protection, usually up to one metre for 30 minutes under specified test conditions. Seals can still age. Cable openings matter too. I inspect the display edge, buttons, and connector cover, not only the printed rating.
Sunlight exposes weak screens quickly. Look for a high-luminance display, ideally with tested outdoor readability rather than a vague “sun-readable” claim. The Outdoor Power Equipment Institute reports that lithium-ion battery use continues expanding across small electric mobility equipment, increasing the need for clear battery information in changing conditions. However, brightness alone can drain power faster. I prefer adjustable brightness, strong contrast, anti-glare glass, and simple digits. Some screens look impressive indoors. They fail on a bright road. Ask for test evidence, viewing-angle data, and the standard’s test conditions. A rating label is useful, but it is not the whole story.
10 Ebike Display Tips Every Buyer Should Know
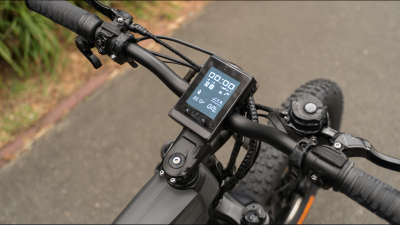
A display is your control center, not just a speed number. Test every button while wearing cycling gloves. The screen should remain readable in direct sunlight and during evening rides. Check battery percentage, assist level, speed, trip distance, and walk-assist controls. A vague menu can become frustrating after a long climb.
Tip: Ask the seller to trigger or explain common error codes. Photograph the code list before purchase. Confirm whether faults identify a sensor, brake cutoff, motor, or communication problem. Connectivity also deserves attention. Test Bluetooth pairing, app permissions, firmware updates, and offline riding. A connected display may collect location data, so review privacy settings carefully. I would not assume every update improves usability.
UL 2849 evaluates an electric bicycle’s electrical system, including the battery, charger, wiring, and drive system. It is useful safety information, but certification is not permission to ignore inspection or charging guidance. The U.S. Consumer Product Safety Commission reported 233 micromobility-related deaths from 2017 through 2022. Its reports repeatedly emphasize fire and injury risks involving batteries, chargers, and damaged equipment. UL 2849 marking should match the exact bicycle system, not a similar-looking component. PeopleForBikes reported that U.S. e-bike sales exceeded one million units in 2022, making clear buyer checks increasingly important. Test the display twice. Small doubts matter.
Test controls, understand error codes, check connectivity, and verify UL 2849 safety information before buying.
Confirm that the display responds correctly to power, assist-level, light, walk-assist, and mode buttons.
Check speed, battery state, assist level, distance, remaining range, and warning indicators in normal riding conditions.
Error codes are system-specific. Ask for the user manual and learn whether a warning requires stopping, restarting, or professional service.
Bluetooth or app connectivity is a convenience feature, not proof of safety. Look for clear UL 2849 information covering the complete electrical system, not only the display.
Chart data: maximum assisted speed in the common U.S. three-class e-bike framework. Class 1 and Class 2 are limited to 20 mph, while Class 3 pedal assistance is limited to 28 mph. Local regulations may differ.