
Choosing the right Touch Display Panel supplier in 2026 requires more than comparing unit prices. Global demand is expanding across automotive consoles, medical equipment, factory terminals, retail kiosks, and smart home devices. Fortune Business Insights estimates that the global touchscreen market could grow from USD 82.75 billion in 2024 to USD 154.56 billion by 2032. Grand View Research also forecasts strong growth, although its market definition and figures differ. Numbers disagree. That matters.
Supplier evaluation should include visible and hidden performance. Check brightness under direct sunlight, glove operation, wet-finger accuracy, optical bonding quality, and response time. A panel that looks excellent in a showroom may fail beside a vibrating machine. Review defect rates, ISO-certified production systems, warranty terms, and monthly capacity. Ask for test records, not attractive samples alone. Long-term reliability deserves attention.
Ross Young, founder and former chief executive of Display Supply Chain Consultants, has described the sector plainly: “The display industry is cyclical.” His observation remains useful for procurement teams. Prices can fall quickly, while tooling, component shortages, and engineering support can change the real cost. Omdia’s display market research also highlights shifting technology demand, including OLED, mini-LED, and advanced in-cell solutions. Still, a supplier ranking cannot fit every project. This is an imperfect starting point. The best choice depends on application temperature, touch technology, interface requirements, annual volume, and after-sales response. A careful 2026 comparison should reward proven performance, transparent evidence, and practical cooperation—not only impressive growth claims.
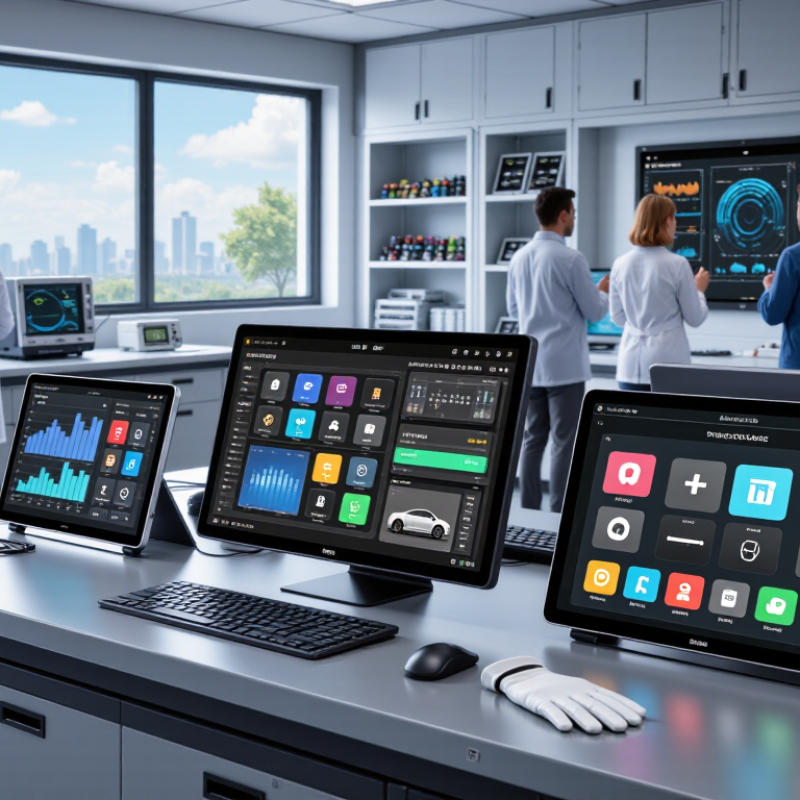
Choosing a touch display panel supplier in 2026 requires measurable specifications. Define the diagonal size, active area, aspect ratio, bezel width, and mounting depth. A 10.1-inch panel may still fail if its tabs or cable position conflict with the enclosure. Request mechanical drawings, tolerance tables, and production samples before approval. Small mismatches become expensive during assembly.
Cover glass strongly affects durability and usability. Specify thickness, surface hardness, optical clarity, edge shape, and anti-glare treatment. A 2.5D edge can improve handling, but it may complicate sealing. Interface selection also needs careful testing. Separate the display interface from the touch interface, then verify connector type, protocol stability, firmware support, latency, and electromagnetic performance. Ask for protocol documents and test records, not broad promises.
Ten touch points should mean more than a number on a datasheet. Test ten or more fingers simultaneously, including fast gestures, palm contact, gloves, and light moisture. Measure response near corners and along the bezel. I once assumed a high touch count guaranteed smooth operation. It did not. The sample lost tracking during wet-finger tests. Reliable suppliers should provide repeatable results across temperature, humidity, and production batches, with clear limits and corrective procedures.
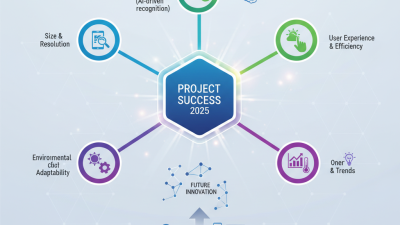
Omdia’s 2025 OLED shipment data offers a practical starting point for estimating 2026 touch display demand. Shipment volume reflects real production activity, not just supplier promises. A rising OLED shipment base may support stronger demand for integrated touch panels, especially in premium smartphones, tablets, vehicles, and industrial equipment.
However, shipment data does not identify the best supplier by itself. Buyers should compare touch sensitivity, optical clarity, cover-glass compatibility, and defect rates. A panel can look bright in a laboratory yet perform poorly with wet fingers or gloves. That detail matters on a factory floor.
Supplier capacity also deserves close review. Can the supplier maintain uniform thickness across large batches? Can it respond when specifications change? These questions reveal operational experience. Delivery records, process audits, and sample testing provide stronger evidence than polished presentations.
The 2025 data may suggest where demand is moving, but it cannot predict every 2026 purchase order. Some forecasts will miss. Flexible suppliers may still win contracts through faster engineering support and steadier quality. I would also examine repair rates, regional service coverage, and long-term material stability before naming a preferred partner. Cost remains important, but the cheapest panel can create expensive redesign work later.
At 500+ cd/m², panel selection depends on more than peak brightness. TFT-LCD remains the practical choice for large touch displays. Its mature supply chain supports stable pricing, long production cycles, and strong daytime visibility. Mini-LED backlights can deliver deeper contrast than standard LCD. However, local dimming may create halos around white text. OLED produces excellent blacks and fast touch response. Sustained brightness can fall during large white images. That weakness matters in dashboards and retail interfaces.
TrendForce’s 2024 Mini-LED report estimated global Mini-LED TV shipments near 6.3 million units. This indicates growing capacity, but not unlimited panel availability. DSCC’s 2024 OLED Display Report also identified continued OLED expansion across monitors and automotive applications. Field evaluations still show uneven results between suppliers. A panel rated at 500 cd/m² may reach that figure only briefly. VESA DisplayHDR 500 requires at least 500 cd/m² peak luminance, not continuous full-screen output. This distinction is easy to miss.
Tips: Request a 30-minute full-white brightness test, not a peak flash. Check touch accuracy through glass, glove operation, heat rise, and dimming behavior. Ask suppliers for luminance uniformity data and lifetime testing at maximum brightness. TFT-LCD often wins on serviceability. OLED may win in thin, high-contrast designs. Mini-LED sits between them, but calibration quality can decide the result. Cost forecasts are imperfect. Your enclosure, firmware, and cooling design may matter more than the panel label.
| Panel Technology | Typical Sustained Brightness | Contrast Performance | Color Gamut Capability | Typical Response Time | Touch Integration | Estimated Service Life | Relative Cost Level | Best-Fit Applications | Supplier Evaluation Focus |
|---|---|---|---|---|---|---|---|---|---|
| TFT-LCD (High-Brightness IPS or VA) |
500–1,000 cd/m² Higher-output industrial versions may exceed 1,000 cd/m². |
Approximately 1,000:1–3,000:1 native contrast, depending on the LCD mode and optical stack. | Typically 100% sRGB; wide-gamut configurations commonly reach approximately 90–100% DCI-P3. | Approximately 5–15 ms gray-to-gray, depending on the panel mode and overdrive settings. | Well suited to projected-capacitive touch, including glove-touch and wet-finger options when properly configured. | Typically 50,000–100,000 operating hours for commercial or industrial backlight assemblies, subject to brightness and thermal conditions. | Low to medium | Industrial HMIs, vehicle displays, point-of-sale terminals, medical equipment, outdoor kiosks, and general commercial displays. | Check uniformity, viewing angle, optical bonding, backlight dimming, touch-controller compatibility, and long-term panel availability. |
| OLED (Self-emissive) |
500–800 cd/m² sustained Short-duration HDR peaks can be substantially higher but should not be treated as continuous brightness. |
Pixel-level emission enables near-infinite on/off contrast in dark-room conditions, with no LCD backlight leakage. | Typically 100% sRGB; many wide-gamut panels provide approximately 95–100% DCI-P3. | Usually below 1 ms pixel response, providing excellent motion clarity. | Highly compatible with projected-capacitive touch; cover-glass thickness and optical bonding should be specified carefully. | Often specified around 30,000–100,000 hours, with lifetime varying by luminance, temperature, duty cycle, and image content. | Medium to high | Premium handheld equipment, automotive interiors, high-end control panels, portable medical devices, and applications requiring deep blacks. | Evaluate burn-in mitigation, image-retention policy, thermal management, brightness uniformity, warranty conditions, and minimum-order flexibility. |
| Mini-LED LCD (LCD with mini-LED local dimming) |
1,000–2,000 cd/m² sustained Peak HDR values may be higher depending on the number of dimming zones and thermal design. |
Native LCD contrast is typically about 1,000:1–3,000:1; local dimming can deliver effective HDR contrast above 100,000:1 in suitable scenes. | Commonly 100% sRGB and approximately 95–100% DCI-P3 with a suitable quantum-dot or wide-gamut optical film. | Approximately 5–12 ms gray-to-gray, depending on the underlying LCD panel and tuning. | Compatible with projected-capacitive touch, but the thicker optical stack may require tuning for sensitivity and pen performance. | Typically 50,000–100,000 operating hours for the LED backlight system, with performance affected by heat and sustained brightness. | Medium to high | Sunlight-readable displays, automotive systems, professional monitors, outdoor terminals, industrial visualization, and HDR-capable touch products. | Compare LED count, local-dimming-zone layout, halo control, thermal design, uniformity, power draw, optical bonding, and touch noise immunity. |
| Procurement note: Brightness values are representative sustained ranges rather than guaranteed specifications for every panel size. Final selection should be based on the supplier’s measured data for the exact panel, cover glass, touch sensor, optical bonding, operating temperature, and target duty cycle. A brightness level of 500 cd/m² or higher should be verified after touch integration and any anti-glare or anti-reflective treatment. | |||||||||
Choosing the best touch display panel supplier in 2026 requires more than comparing brightness, price, or delivery time. Audit the quality system first. The ISO Survey 2022 recorded over 1.2 million ISO 9001 certificates worldwide, yet certification alone does not guarantee stable panel performance. Request the certificate scope, audit history, corrective-action records, and production-site details. Then sample records for glass bonding, optical inspection, calibration, and lot traceability.
Safety evidence must match the final product. IEC 62368-1 evaluates energy hazards in audio, video, information, and communication technology equipment. Ask suppliers for current test reports, critical-component lists, insulation data, and change-control procedures. A certificate for an older model may not cover a revised touch controller or backlight.
That gap is easy to miss. It should not be.
IP65 also needs physical verification. The first rating requires dust-tight protection; the second covers water jets. Inspect enclosure drawings, gasket compression, connector sealing, and test conditions. Repeat testing after thermal cycling and repeated cleaning. Industry forecasts, including MarketsandMarkets’ touchless and touchscreen technology analyses, indicate continued demand for durable interfaces in industrial and medical environments. However, market growth figures do not prove supplier reliability.
Visit the factory when possible. Watch a real incoming-inspection process, not a prepared demonstration. Compare defect data with shipment records and customer returns. Leave room for doubt. A supplier may pass one audit and still struggle with engineering changes, rushed batches, or poor communication. A practical scorecard should weight verified evidence above polished presentations.
The best touch display panel supplier is not always the cheapest one.
A practical ranking should combine yield, lead time, warranty, and total cost per panel. Omdia’s 2024 Display Long-Term Demand Forecast shows LCD remains important across automotive, industrial, and consumer devices. That scale can support stable pricing, but it does not guarantee strong touch yields.
Yield deserves the highest weight.
Ask for three months of first-pass yield data, not a single impressive sample. A supplier producing 96% usable panels may beat one offering a lower unit price at 91% yield.
Lead time should include glass, sensor, controller, inspection, and ocean freight. A 21-day factory promise can become 45 days at the receiving dock. It happens. The weak point is often logistics.
Warranty terms must specify defect definitions, replacement timing, and field-failure limits. Use IEC 60068 environmental testing and record results by temperature, humidity, and touch cycles.
Total cost should include tooling, rejects, freight, inspection, rework, and inventory financing. Reports from DSCC and Omdia consistently show display pricing changes with utilization, capacity balance, and panel technology. Therefore, refresh quotations quarterly.
A supplier with a 12-month warranty may still cost more than one with 18 months if its yield is unstable.
I would score yield at 35%, lead time at 25%, warranty at 15%, and total cost at 25%.
Not perfect, but measurable.